Effects of Different Silicon Source Treatment on Rice Seedlings 2018-09
Effects of Different Silicon Source Treatment on Rice Seedlings
National Pingtung University of Science and Technology Department of Plant Industry
|
1. Introduction Silicon (Si) is an essential mineral nutrient element for plant growth and development. It plays an important role in plants. The application of silicon fertilizer can form a cuticle-silicon double layer under the epidermal tissue, which can significantly improve rice lodging resistance. During rice growth, silicon fertilizer can make the extension angle of rice leaves smaller and the leaves stand upright to improve the photosynthetic efficiency. In addition, silicon may form complexes with organic compounds in the epidermal cell wall, thereby increasing its resistance to enzymatic degradation. Therefore, in this experiment, rice seedlings were treated with three types of silicon sources, including silicon dioxide (liquid), silicon dioxide (colloidal), and potassium silicate, to understand the effects of different silicon sources on rice growth and antioxidant activity. 2. Material method 3. Results (a) Liquid silica (Liq): 0x, 1,000x, 1,500x and 2,000x. From the table below (Table 1), it can be seen that the optimum concentration of each silicon source is: liquid silica 1,000x, colloidal silica 1,000x, and potassium silicate 1,500x. In this experiment, it can be found that in terms of plant height, liquid silica and potassium silicate have better effects, followed by colloidal silica. In terms of dry weight above ground, potassium silicate is higher; in terms of dry weight for underground parts, the effect of silica is better than that of potassium silicate, and the effect of colloidal silica is better. |
Table 1. Effects of different silicon source concentration treatments on rice agronomic traits
| Silicon source | Concentration | Plant height (cm) | Root length (cm) | Above ground | Underground | ||
| Fresh weight (g) | Dry weight (g) | Fresh weight (g) | Dry weight (g) | ||||
| Liquid silica | 0x | 19.28 ABa | 13.64 Aa | 0.572 | 0.0909 | 0.05 | 0.0347 |
| 1,000x | 19.77 ABa | 13.15 Aa | 0.6086 | 0.0964 | 0.046 | 0.0363 | |
| 1,500x | 18.95 ABa | 12.89 .Aa | 0.5214 | 0.0891 | 0.0369 | 0.0314 | |
| 2,000x | 19.13 ABa | 12.76 Ab | 0.5332 | 0.0925 | 0.0435 | 0.0357 | |
| Colloidal silica | 0X | 18.3 Bb | 12.36 Aa | 0.5472 | 0.0946 | 0.0726 | 0.037 |
| 800x | 17.53 Bc | 12.62 Aa | 0.5283 | 0.0895 | 0.0836 | 0.0414 | |
| 1,000x | 19.06 Ba | 12.16 Aa | 0.6097 | 0.1034 | 0.1164 | 0.0449 | |
| 1,500x | 18.99 Ba | 12.34 Aa | 0.5957 | 0.0962 | 0.0878 | 0.0396 | |
| Potassium silicate | 0x | 19.8 Ad | 11.47 Ba | 0.5894 | 0.0839 | 0.067 | 0.0377 |
| 1,000x | 20.44 Ac | 9.65 Ba | 0.5854 | 0.0982 | 0.0412 | 0.0285 | |
| 1,500x | 21.52 Ab | 10.04 Ba | 0.6667 | 0.1106 | 0.0589 | 0.0325 | |
| 2,000x | 22.10 Aa | 9.46 Ba | 0.6513 | 0.1157 | 0.0329 | 0.0285 | |
| Uppercase letters indicate differences among treatments with different silicon sources; lowercase letters indicate differences among treatments with different concentrations of the same silicon source. Different letters indicate significant differences between treatments (P ≤ 0.05). |
| Observing the appearance of rice seedlings with the optimum concentration of different silicon sources, there was no significant difference in appearance between each treatment (Fig. 1), indicating that different silicon sources did not affect the growth of rice seedlings after treatment. |
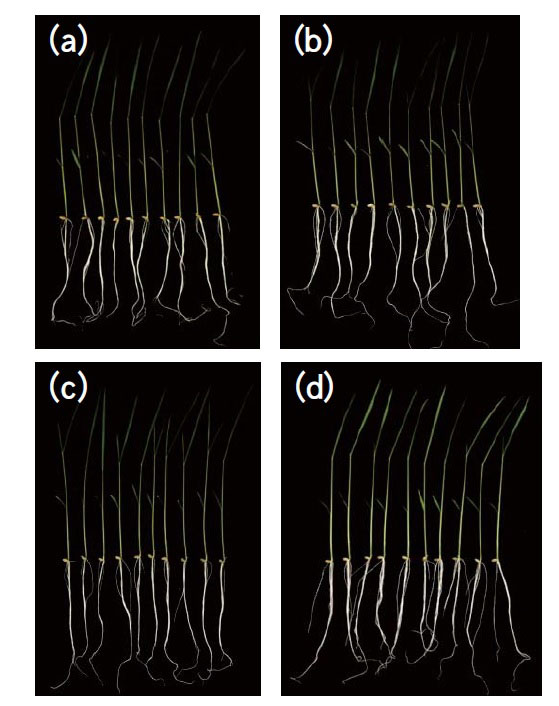 |
Figure 1. Effects of different silicon sources on the growth of rice seedlings. After one week of rice growth, untreated (a), liquid silica 1,000x (b), colloidal silica 1,000x (c), and potassium silicate 1,500x (d). |
2. Effects of different silicon sources on chlorophyll in rice
When the rice grew to three-leaf stage, 90-100 mg of rice leaves from each treatment were used for the determination of chlorophyll content, and four replicates were performed. From the research results in Table 2, it can be seen that there is no significant difference in chlorophyll content between each silicon source treatment and the control group, indicating that different silicon source treatments will not have a negative impact on rice physiology.
| Table 2. Effects of different silicon source treatments on chlorophyll in rice seedlings | ||||
| Silicon source | Concentration | Chlorophyll a content | Chlorophyll b content | Total chlorophyll content |
| Control group | 0x | 1.62±0.15a | 0.43±0.05a | 2.05±0.20a |
| Liquid silica | 1,000x | 1.61±0.10a | 0.42±0.03a | 2.03±0.13a |
| Colloidal silica | 1,000x | 1.53±0.06a | 0.40±0.02a | 1.93±0.08a |
| Potassium silicate | 1,500x | 1.42±0.18a | 0.37±0.05a | 1.79±0.23a |
Different letters indicate differences in treatment (P ≤ 0.05)
3. Effects of different silicon source treatments on the activities of antioxidant enzymes in rice seedlings
The rice was treated with the optimum concentration of different silicon sources, and the activity of antioxidant enzymes was analyzed. The results showed that there was no significant difference in SOD activity and CAT activity compared with the control group. However, in terms of APX activity performance, all rice seedlings treated with silicon source decreased APX activity, but in terms of GR activity performance, colloidal silica treatment showed a higher trend (Fig. 2).
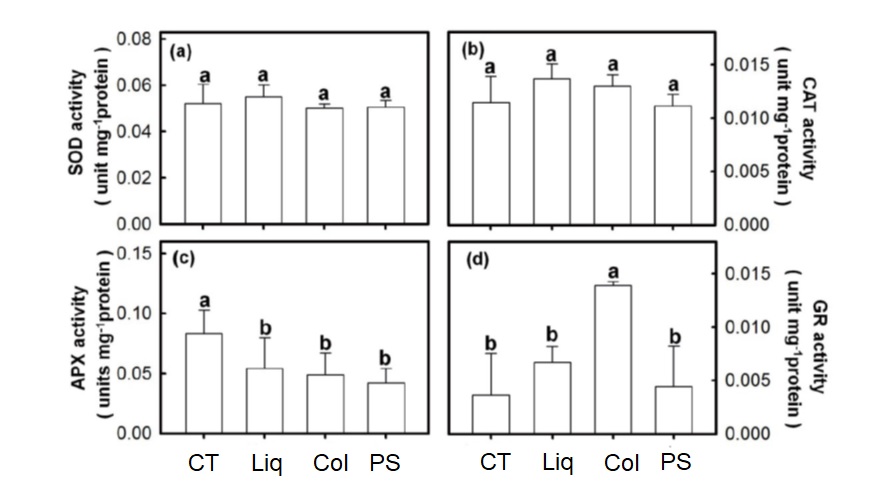 Figure 2. Effects of different silicon source treatments on the activities of antioxidant enzymes SOD (a), CAT (b), APX (c), and GR (d) in rice seedlings.
4. Conclusion
Based on the above results, after the rice seedlings were treated with different silicon sources, 1,000x liquid silica, 1,000x colloidal silica, and 1,500x potassium silicate were the optimal treatment concentrations. In terms of activity change, the effect of silica treatment is better than that of potassium silicate, among which colloidal silica can increase the dry weight underground and increase the trend of GR activity. The test results can be used as a reference for farmers when choosing silicon fertilizers.